Friday 14 December 2012

 Fridays 14th December '12 setup


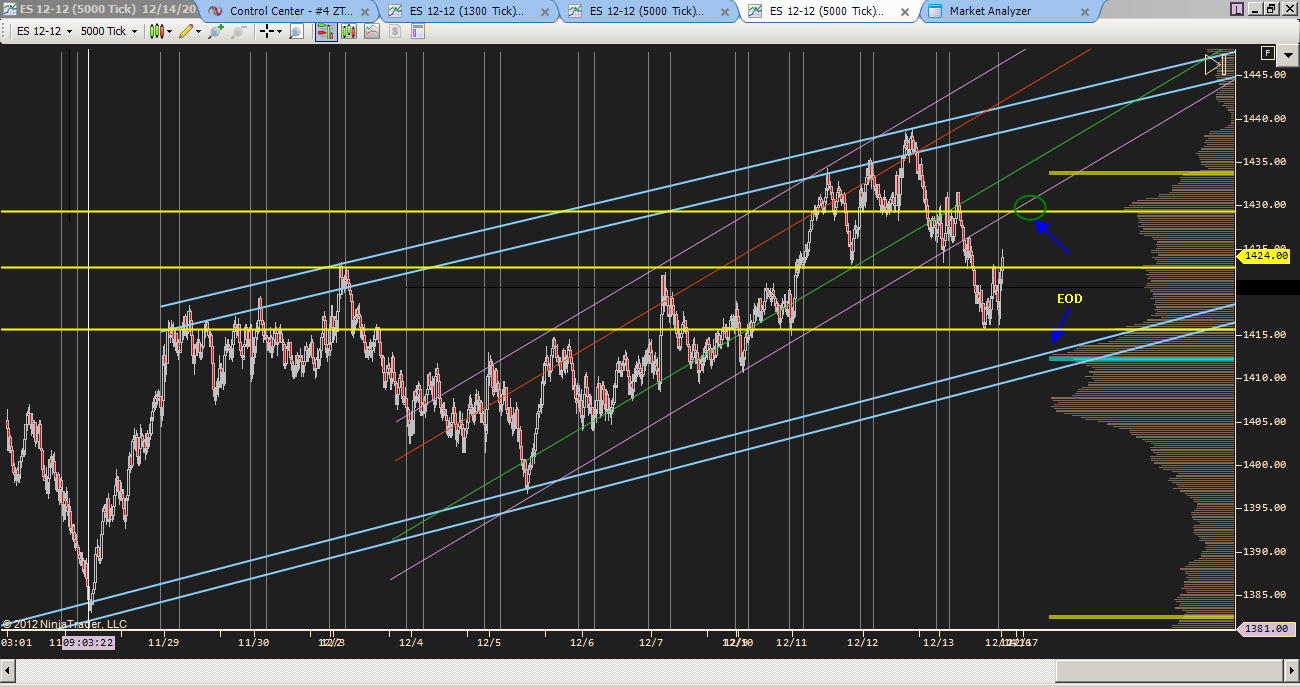
 From the bigger picture we can see the channel clearly broken to the downside yesterday - this is likely due to roll over / options expiration / holiday reversion to the mean (1412.5 POC cyan line on VP). I believe we would need to see a break of the long term support (blue parallel line) to see a failure of the current trend. Consider that the POC is the area at which most trade has been conducted and therefore by extension the value at which most traders are comfortable. A consideration as we approach the holidays.
Another consideration is the fact that many bigger market participants will be reducing exposure (covering longs) and will not be re-opening positions till the new year leading to what appears to be the start of a 'drop and pop' type setup which, in the new year and barring catastrophe over the holiday, may see us breaking the upper long term trend line and making new highs.
Either way our job is simply to continue taking opportunity as we see it until we ourselves also decide to break for the holiday.

Close-up


My inclination is that today we will see a rally back to the point of the break down or trend line break (green circle), shaking out weaker shorts (this is a classic pattern) and then we may see a fall to the long term support area (blue parallel lines) - this also coincides with the POC and in all represents about a 16 point range, same as yesterday and the 5 day ATR is 13 (in round numbers) so not a massive extension of the norm.
The yellow lines are S&R over the longer term and are at 1415.50, 1423 and 1429.25. Just areas that will provide trade opportunities today.

Only major influences on the market today would be a proclamation of a resolution to the 'Fiscal Cliff' debacle. Whilst announcements (CPI @ 7:30 cst and Ind' Prod' @ 8:15 cst) have the potential today to move the market I don't believe they will do anything other than support the prevailing short term momentum.

Barring any change in circumstances between this post and the open I will be short today from 1429.50.

Thursday 13 December 2012


Can see the spike crosses the trend line (magenta) that signaled the break down from the bear flag. Then price returned to the area it traded in before the news ! Classic HFT !!

Tuesday 11 December 2012

Fiscal Cliff + Holiday = Cautious Trading

(A lesson I have learnt to late)

Having thought I was at least 60% of the way to trading professionally I have, over the last 10 days or so, been humbled by the market. I can blame the market - I thought it would just plunge after the elections given all the issues with the US deficit, EU debt, decline in demand worldwide etc etc etc but we all should accept that we are responsible for our own actions - even if too late - it felt like the market had barely stayed afloat, flaying madly at the surface of a sea of woe and bad news before it eventually succumbed to the inevitable and shed 200 or so points. This may well still happen but with each day it doesn't it looks less likely and re-reading parts of Schwager's "Market Wizards" I was struck by an interview excerpt from William Eckhardt - lifetime trend-follower and all round mathematical genius who suggests (and I paraphrase) that if despite all the bad news a market manages to stay buoyant, it is likely due to (as yet unrevealed) underlying strength and will likely move to new highs when the current uncertainty, confining the move; has been resolved. With that in mind I started looking at the ES from a different perspective and noted the following -


 The above is a 14 day 5000T chart of the ES with a 31 day volume profile (tells us about the preceding month rather than some arbitrary non-relevant number like 200). The reason for using ticks is that it eliminates the distortion caused by long periods of time with little volume (overnight). We can instantly see that for the last 8 or 9 days we have traded at the top of the balance area around the point of control (cyan line on left). The trend channel is clear (magenta = 50%; red/green = 25 or 75%).


This is a closer look at the last 5 or so days - the image is self explanatory but note the RSI plot. The lows rarely fall below 30 and during pit hours consistently find support in the green zone. This all points to a desire within the market to maintain these levels until the current issues are resolved - the fact that we have not seen a selling or 'risk-off' scenario supports the theory of underlying but as yet unseen strength.

For the foreseeable future it may be prudent to trade only from these lines and ignore everything that you may wish to see in between them. I have unfortunately seen this too late for it to be of much help to me other than securing a combine rollover (if I'm lucky) - however i hope others may profit or at least prevent meltdown! In the mean time I have to write another lesson into my rapidly expanding tome of "hard knocks".